Friday, May 17, 2013

Friday, April 26, 2013
Union Budget 2013-14 : Highlights

Union Finance Minister P. Chidambaram presented his much anticipated budget proposals for the year 2013-14, bringing a partial relief for the lower income groups as no changes were made in Income Tax rates or slabs. His budget could be lauded for certain proposals like set up of a first women’s bank, Rs 1 lakh deduction for home loans and more focus on health, education, HRD and rural development.
However, most of the commodities and articles get costlier in the budget proposals. Smartphones, Cigarettes, watching movies and eating out in AC restaurants will be more expensive in the coming days. Even though, Chidambaram called “higher growth leading to inclusive, sustainable development” as his government’s mantra, he failed to satisfy middle class society presenting the budget today. The government expected to get Rs 13,300 crore from change in direct tax and indirect tax proposal to yield Rs 4,700 crore.
The Fiscal deficit was marginally lower(5.2) than Economic Survey deficit figure of 5.3%, but it is enough to stop market decline for time being, as the minister expected.
Chidambaram looked more energetic while announcing the proposals for the fiscal 2013-14, which is the last budget before the general elections. He looked forward to change the fortunes of India, Asia’s third largest economy, after years of policy paralysis and global economic turmoil. He admitted that Indian export has been hit and global economy has slowed in the current fiscal. He said that Indian economy has slowed after 2010.
However, he defended the government for Food inflation and price hike that put pressure on common men in India. The slow economy has affected all the nations, only China and Indonesia are growing faster than India. Hence, there was no reason for gloom or pessimism. He stressed on the encouragement of foreign investment, which should be the economic objective for a developing nation. He claimed that the government is committed to work towards development of the nation. He talked about the proposed National Food Security Bill, which is the promise of the UPA government.
Proposals:
1. Rs 1630825 crore total expenditure, Rs 555322 crore plan expenditure, non-plan Rs 1199074 crore
2. Rs 41000 crore for Scheduled Caste and Rs 28500 crore for tribal welfare.
3. Rs 3,511 crore allocated to Minority Affairs Ministry which is 60% of the revised estimates.
4. Health and education for all remain priorities. Over Rs 33000 crore to health
5. Rs 4727 crore for medical research. Rs 1069 cr for the development in the ayurveda, allopathy and Homeopathy medical science
6. Rs 21,000 crore allocation for health sector
7. Allocation of Rs 65,000 crore for education sector
8. Rs 65000 crore to ministry of education, Rs 27257 crore to Sarva Shiksha Avijan
9. Rs 3983 for Rashtriya Madhyamik siksha abhiyan
10. Rs 13215 crore for mid-day meal scheme
11. Rs 17700 crore for ministry of children
12. Rs 110 crore to dept of disability affairs under specific scheme
13. Rs 1400 crore for water purification
14. Rs 65,867 cr allocated to ministry of human resources, 17% increase in budgetary support.
15. Rs 33000 crore for MNREGA
16. Rs 3400 crore for agricultural research
17. Rs 700000 crore for agricultural credit schemes.
18. Rs 1000 crore to support increased rice production in Eastern Indian states.
19. Rs 9954 crore and Rs 2250 crore for crop diversification under different schemes.
20. Rs 500 crore for crop diversification
21. Rs 15269 crore for water and sanitation
22. Rs 14,800 crore under JNNURM. Positive for Ashok Leyland, Tata Motors
23. National Livestock Mission launched with Rs 307 crore
24. Rs 10000 crore set apart for National Food Security Bill (if passed)
25. Rs 1650 crore for six more AIIMS-like medical institutes, which will start functioning this year.
26. All flagship programmes fully funded
27. Indian Institute of BioTechnology to be set up at Ranchi
28. Flagship Education scheme, Sarva Shiksha Abhiyan will receive 27,258 crore
29. Rs 5000 crore to NABARD to build cold storages and godowns
30. Rs 25000 crore to be raised from four infrastructure bonds
31. Rs 100 crore in machinery investment can avail an extra 15 per cent exemption over and above existing relaxations
32. Infra debt fund to be encouraged
33. First home loan up to Rs 25 lakh during 2013-14 will get an additional Rs 1 lakh interest deduction.
34. Income level for Rajiv Gandhi Equity Scheme raised by Rs 2 lakh
35. Zero custom duty for electrical machinery
36. Foodgrain production in 2013-14 will be over 250 million tonnes
37. RGESS to be liberalised to enable first time investor, income limit to be raised to Rs 10 lakh
38. Inflation indexed bonds and NSCs to be introduced
39. Coal imports to rise to 185 million tonnes from 100 million in four years.
40. A PPP project with Coal India in the pipeline to stem the outflow of forex.
41. New regulatory authority for road sector
42. Technology Upgrade scheme for textile sector to get Rs 2400 crore
43. Cabinet Committee on Investment formed to look into investments in various sectors
44. Work has started on the Bengaluru-Mumbai industrial corridor
45. RG Equity Saving Scheme to be liberalised to enable first time investor, income limit to be raised to Rs 12 lakh
46. Handloom sector to get an additional Rs 96 crore
47. Rs 80194 crore for rural development projects
48. To Introduce Inflation Indexed Bonds for two new ports in West Bengal and Andhra Pradesh.
49. 13 Public Sector Banks to get Rs 14000 crore
50. All Public Sector bank branches to have ATMs by end of 2014.
51. Proposal to set up first women’s public sector bank with Rs 1,000 crore by October 2013.
52. Rural housing to get Rs 6000 crore, urban housing Rs 2000 crore
53. NHB to set up Urban Housing bank
54. Banks permitted to act as insurance brokers; public sector banks can now set up ‘adalats’ and settle disputes over claims
55. Domestic workers, Anganwadi workers, etc to get group insurance
56. to review natural gas pricing policy
57. Comprehensive social security package for the most down-trodden and poor in the anvil
58. KYC of banks enough to get insurance
59. 17 per cent hike in education, 22 per cent in agriculture, 46 per cent for rural development
60. All towns of India with a population of over 10000 to have an LIC office
61. Rs 11500 crore for backward areas
62. National Skill Development Corporation to train 5 crore people in current plan period.
63. Rs 11,500 cr allocated as Backward Regions Grant Fund for Bihar, Bundelkhand and KBK region of Odisha
64. Defence gets Rs 2,20,000 crore (additional funds to be provided if needed), 86721 crore for capital expenditure.
65. Rs 5400 crore to department of space and Rs 5600 crore to department of atomic energy.
66. National Institute of Sports Coaching to be set up in Patiala at a cost of Rs 253 crore
67. Rashtriya Swasthya Bima Yojana to include rickshaw pullers, taxi drivers and ragpickers.
68. Rs 5,80,000 crore to states and Union Territories
69. Rs 1,000 crore for Nirbhaya Fund proposed for safety of women
70. Women, youth and poor are priority for the Government
Tax Proposals:
1. No changes in Income Tax rates or slabs
2. Relief for Rs 2-5 lakh income group. Rs 2000 tax credit for those earning up to Rs 5 lakh per annum.
3. Surcharge of 10% on income above Rs 1 crore per annum. Additional surcharge is only for a year
4. Surcharge on corporate taxes increased.
5. Slabs of 30%, 20% and 10% will continue.
6. DDT surcharge raised to 10% for 1 Year.
7. The educational cess for all taxpayers shall continue for one year
8. Education cess to continue at 3 per cent
9. 10 pc tax deduction for donations to National Children’s fund
10. TDS at 1 per cent on value of transfer of immovable property of over Rs 50 lakh
11. Introduces commodity transaction tax
12. proposes cut in STT rate
13. Agricultural commodity exempt from CTT
14. No change in basic rates in customs and excise duty
15. 1 per cent TDS on sale of immovable property over Rs. 50 lakh, not applicable to agricultural land.
16. Lower securities transaction tax on mutual fund payouts
17. Cigarettes and SUVs get costlier. 100 per cent Customs Duty on luxury cars. Specific excise duty on cigarettes increased by 18 per cent
18. Import duty on raw silk hiked to 15%
19. Six per cent duty on mobiles worth more than Rs 2,000.
20. Tax on motor vehicles up from 75 per cent to 100 per cent. Excise duty on certain SUVs hiked to 30 per cent
21. Set Top box import duty raised
22. Gold duty free limit raised to Rs 50,000 for men and to Rs 1 lakh for women travellers
23. Service tax to now apply on all A/C restaurants. All AC restaurants will have to pay service tax whether or not they serve alcohol.
The Fiscal deficit was marginally lower(5.2) than Economic Survey deficit figure of 5.3%, but it is enough to stop market decline for time being, as the minister expected.
Chidambaram looked more energetic while announcing the proposals for the fiscal 2013-14, which is the last budget before the general elections. He looked forward to change the fortunes of India, Asia’s third largest economy, after years of policy paralysis and global economic turmoil. He admitted that Indian export has been hit and global economy has slowed in the current fiscal. He said that Indian economy has slowed after 2010.
However, he defended the government for Food inflation and price hike that put pressure on common men in India. The slow economy has affected all the nations, only China and Indonesia are growing faster than India. Hence, there was no reason for gloom or pessimism. He stressed on the encouragement of foreign investment, which should be the economic objective for a developing nation. He claimed that the government is committed to work towards development of the nation. He talked about the proposed National Food Security Bill, which is the promise of the UPA government.
Proposals:
1. Rs 1630825 crore total expenditure, Rs 555322 crore plan expenditure, non-plan Rs 1199074 crore
2. Rs 41000 crore for Scheduled Caste and Rs 28500 crore for tribal welfare.
3. Rs 3,511 crore allocated to Minority Affairs Ministry which is 60% of the revised estimates.
4. Health and education for all remain priorities. Over Rs 33000 crore to health
5. Rs 4727 crore for medical research. Rs 1069 cr for the development in the ayurveda, allopathy and Homeopathy medical science
6. Rs 21,000 crore allocation for health sector
7. Allocation of Rs 65,000 crore for education sector
8. Rs 65000 crore to ministry of education, Rs 27257 crore to Sarva Shiksha Avijan
9. Rs 3983 for Rashtriya Madhyamik siksha abhiyan
10. Rs 13215 crore for mid-day meal scheme
11. Rs 17700 crore for ministry of children
12. Rs 110 crore to dept of disability affairs under specific scheme
13. Rs 1400 crore for water purification
14. Rs 65,867 cr allocated to ministry of human resources, 17% increase in budgetary support.
15. Rs 33000 crore for MNREGA
16. Rs 3400 crore for agricultural research
17. Rs 700000 crore for agricultural credit schemes.
18. Rs 1000 crore to support increased rice production in Eastern Indian states.
19. Rs 9954 crore and Rs 2250 crore for crop diversification under different schemes.
20. Rs 500 crore for crop diversification
21. Rs 15269 crore for water and sanitation
22. Rs 14,800 crore under JNNURM. Positive for Ashok Leyland, Tata Motors
23. National Livestock Mission launched with Rs 307 crore
24. Rs 10000 crore set apart for National Food Security Bill (if passed)
25. Rs 1650 crore for six more AIIMS-like medical institutes, which will start functioning this year.
26. All flagship programmes fully funded
27. Indian Institute of BioTechnology to be set up at Ranchi
28. Flagship Education scheme, Sarva Shiksha Abhiyan will receive 27,258 crore
29. Rs 5000 crore to NABARD to build cold storages and godowns
30. Rs 25000 crore to be raised from four infrastructure bonds
31. Rs 100 crore in machinery investment can avail an extra 15 per cent exemption over and above existing relaxations
32. Infra debt fund to be encouraged
33. First home loan up to Rs 25 lakh during 2013-14 will get an additional Rs 1 lakh interest deduction.
34. Income level for Rajiv Gandhi Equity Scheme raised by Rs 2 lakh
35. Zero custom duty for electrical machinery
36. Foodgrain production in 2013-14 will be over 250 million tonnes
37. RGESS to be liberalised to enable first time investor, income limit to be raised to Rs 10 lakh
38. Inflation indexed bonds and NSCs to be introduced
39. Coal imports to rise to 185 million tonnes from 100 million in four years.
40. A PPP project with Coal India in the pipeline to stem the outflow of forex.
41. New regulatory authority for road sector
42. Technology Upgrade scheme for textile sector to get Rs 2400 crore
43. Cabinet Committee on Investment formed to look into investments in various sectors
44. Work has started on the Bengaluru-Mumbai industrial corridor
45. RG Equity Saving Scheme to be liberalised to enable first time investor, income limit to be raised to Rs 12 lakh
46. Handloom sector to get an additional Rs 96 crore
47. Rs 80194 crore for rural development projects
48. To Introduce Inflation Indexed Bonds for two new ports in West Bengal and Andhra Pradesh.
49. 13 Public Sector Banks to get Rs 14000 crore
50. All Public Sector bank branches to have ATMs by end of 2014.
51. Proposal to set up first women’s public sector bank with Rs 1,000 crore by October 2013.
52. Rural housing to get Rs 6000 crore, urban housing Rs 2000 crore
53. NHB to set up Urban Housing bank
54. Banks permitted to act as insurance brokers; public sector banks can now set up ‘adalats’ and settle disputes over claims
55. Domestic workers, Anganwadi workers, etc to get group insurance
56. to review natural gas pricing policy
57. Comprehensive social security package for the most down-trodden and poor in the anvil
58. KYC of banks enough to get insurance
59. 17 per cent hike in education, 22 per cent in agriculture, 46 per cent for rural development
60. All towns of India with a population of over 10000 to have an LIC office
61. Rs 11500 crore for backward areas
62. National Skill Development Corporation to train 5 crore people in current plan period.
63. Rs 11,500 cr allocated as Backward Regions Grant Fund for Bihar, Bundelkhand and KBK region of Odisha
64. Defence gets Rs 2,20,000 crore (additional funds to be provided if needed), 86721 crore for capital expenditure.
65. Rs 5400 crore to department of space and Rs 5600 crore to department of atomic energy.
66. National Institute of Sports Coaching to be set up in Patiala at a cost of Rs 253 crore
67. Rashtriya Swasthya Bima Yojana to include rickshaw pullers, taxi drivers and ragpickers.
68. Rs 5,80,000 crore to states and Union Territories
69. Rs 1,000 crore for Nirbhaya Fund proposed for safety of women
70. Women, youth and poor are priority for the Government
Tax Proposals:
1. No changes in Income Tax rates or slabs
2. Relief for Rs 2-5 lakh income group. Rs 2000 tax credit for those earning up to Rs 5 lakh per annum.
3. Surcharge of 10% on income above Rs 1 crore per annum. Additional surcharge is only for a year
4. Surcharge on corporate taxes increased.
5. Slabs of 30%, 20% and 10% will continue.
6. DDT surcharge raised to 10% for 1 Year.
7. The educational cess for all taxpayers shall continue for one year
8. Education cess to continue at 3 per cent
9. 10 pc tax deduction for donations to National Children’s fund
10. TDS at 1 per cent on value of transfer of immovable property of over Rs 50 lakh
11. Introduces commodity transaction tax
12. proposes cut in STT rate
13. Agricultural commodity exempt from CTT
14. No change in basic rates in customs and excise duty
15. 1 per cent TDS on sale of immovable property over Rs. 50 lakh, not applicable to agricultural land.
16. Lower securities transaction tax on mutual fund payouts
17. Cigarettes and SUVs get costlier. 100 per cent Customs Duty on luxury cars. Specific excise duty on cigarettes increased by 18 per cent
18. Import duty on raw silk hiked to 15%
19. Six per cent duty on mobiles worth more than Rs 2,000.
20. Tax on motor vehicles up from 75 per cent to 100 per cent. Excise duty on certain SUVs hiked to 30 per cent
21. Set Top box import duty raised
22. Gold duty free limit raised to Rs 50,000 for men and to Rs 1 lakh for women travellers
23. Service tax to now apply on all A/C restaurants. All AC restaurants will have to pay service tax whether or not they serve alcohol.
Where does the government get its revenue from? - click here
Monday, April 15, 2013
Green Accounting System in India

Green Accounting
Double-digit GDP fixation is threatening India’s biodiversity and its long-term growth and security. Green accounting methods have estimated the loss of ecological wealth in India. GDP measures the value of output produced within a country over a certain time period. However, any depreciation measurements used, will account only for manmade capital and not the negative impact of growth on valuable natural capital, such as water, land, forests, biodiversity and the resulting negative effects on human health and welfare.Over the course of the last fifty years, India has lost over half its forests, 40 per cent of its mangroves and a significant part of its wetlands. At least 40 species of plants and animals have become extinct with several hundred more endangered.
In “green accounting” approach national accounts are adjusted to include the value of nature´s goods and services. Mr Jairam Ramesh, the former environment minister, advocated greening India’s national accounts by 2015 and encouraged policy makers to recognise the trade-off between pursuing high growth economic policies against the extensive impact they could have on India’s natural capital.
The Green Indian States Trust (GIST) which, in 2003 unleashed a series of environmentally adjusted accounts under the Green Accounting for Indian States Project. According to their results, the loss of forest ecological services (i.e.soil erosion prevention, flood control and ground water augmentation) over three years (2001-03) due to declining dense forests was estimated at an astounding 1.1 per cent of GDP.According to GIST´s latest results, the North-Eastern states continue to be most affected, particularly Arunachal Pradesh and Mizoram where the loss of forest ecological services is more than 12 per cent of their NSDP.
India to have green national accounting system
India expects to put in place in five years a system of green national accounting that would take into account the environmental costs of development and reflect the use of precious depletable natural resources in the process of generating national income.Economists estimate gross domestic product (GDP) as a broad measure of national income, while net domestic product (NDP) accounts for the use of physical capital.As yet, we have no generally accepted system to convert gross domestic product into green domestic product that would reflect the use up of precious depletable natural resources in the process of generating national income.
Economists all over the world have been at work for quite some time on developing a robust system of green national accounting but "we are not there as yet". "Ideally, if we can report both gross domestic product and green domestic product, we will get a better picture of the trade-offs involved in the process of economic growth.
World Bank launches ‘green' national accounts initiative
A new global partnership to help developing countries integrate the economics of ecosystems into national accounting systems has been launched by the World Bank.The alarming loss of biological diversity around the world is attributable to the lack of proper valuation of the ecosystems and the services they provide. The valuation and its integration into national accounts are expected to lead to better management of natural environments. According to Mr Robert B. Zoellick, Former President, World Bank Group, the natural wealth of nations should be a capital asset valued in combination with its financial capital, manufactured capital and human capital. The national accounts should reflect the vital carbon storage services that forests provide and the coastal protection values that come from coral reefs and mangroves, he said at a Convention on Biological Diversity held in Nagoya, Japan.
The first phase of the partnership to ‘green' national accounts has been launched starting with India and Colombia, which will be in a group of six to 10 countries. A forthcoming World Bank Publication, titled ‘The Changing Wealth of Nations', states that the commercial value of farmlands, forests, minerals and energy worldwide is more than $44 trillion, of which, the developing countries account for $29 trillion. But, there is more value in the services provided by ecosystems such as forests, like hydrology regulation, soil retention and pollination.
United Nations Environment Programme
The partnership initiative builds on ‘The Economics of Ecosystems and Biodiversity' (TEEB) project of the United Nations Environment Programme (UNEP). It will include developing and developed countries, non-governmental organisations and the global organisation for legislators.
During the initial five-year pilot period, the programme will focus on how countries can quantify the ecosystems and their services in terms of income and asset values; developing ways to incorporate these values into policies on wealth and economic growth; and evolve guidelines for implementation of the valuations worldwide, according to a World Bank report. The feasibility studies to identify priority ecosystems will start soon in India and Colombia, while many other countries in Africa, Asia, Latin America and Central Europe have evinced interest to become partners in the pilot programme.
India, Brazil lead in building green economies
India and Brazil lead the number of countries who are willing to draw on findings from the three-year study project The Economics of Ecosystems and Biodiversity (TEEB) to make their economies more environment-friendly and effectively use the services of nature.The Brazilian and Indian governments are among those keen to use findings from The Economics of Ecosystems and Biodiversity (Teeb) project. Final results from the three-year study were unveiled here at the UN Convention on Biological Diversity meeting.Nature's services must be counted if they are to be valued, its leader said.
More Info :

Tuesday, March 26, 2013
Plate Tectonics

In the early 1960s, the emergence of the theory of plate tectonics started a revolution in the earth sciences. Since then, scientists have verified and refined this theory, and now have a much better understanding of how our planet has been shaped by plate-tectonic processes. We now know that, directly or indirectly, plate tectonics influences nearly all geologic processes, past and present. Indeed, the notion that the entire Earth's surface is continually shifting has profoundly changed the way we view our world.
People benefit from, and are at the mercy of, the forces and consequences of plate tectonics. With little or no warning, an earthquake or volcanic eruption can unleash bursts of energy far more powerful than anything we can generate. While we have no control over plate-tectonic processes, we now have the knowledge to learn from them. The more we know about plate tectonics, the better we can appreciate the grandeur and beauty of the land upon which we live, as well as the occasional violent displays of the Earth's awesome power.
In geologic terms, a plate is a large, rigid slab of solid rock. The word tectonics comes from the Greek root "to build." Putting these two words together, we get the term plate tectonics, which refers to how the Earth's surface is built of plates. The theory of plate tectonics states that the Earth's outermost layer is fragmented into a dozen or more large and small plates that are moving relative to one another as they ride atop hotter, more mobile material. Before the advent of plate tectonics, however, some people already believed that the present-day continents were the fragmented pieces of preexisting larger landmasses ("supercontinents"). The diagrams below show the break-up of the supercontinent Pangaea (meaning "all lands" in Greek), which figured prominently in the theory of continental drift -- the forerunner to the theory of plate tectonics.
People benefit from, and are at the mercy of, the forces and consequences of plate tectonics. With little or no warning, an earthquake or volcanic eruption can unleash bursts of energy far more powerful than anything we can generate. While we have no control over plate-tectonic processes, we now have the knowledge to learn from them. The more we know about plate tectonics, the better we can appreciate the grandeur and beauty of the land upon which we live, as well as the occasional violent displays of the Earth's awesome power.
In geologic terms, a plate is a large, rigid slab of solid rock. The word tectonics comes from the Greek root "to build." Putting these two words together, we get the term plate tectonics, which refers to how the Earth's surface is built of plates. The theory of plate tectonics states that the Earth's outermost layer is fragmented into a dozen or more large and small plates that are moving relative to one another as they ride atop hotter, more mobile material. Before the advent of plate tectonics, however, some people already believed that the present-day continents were the fragmented pieces of preexisting larger landmasses ("supercontinents"). The diagrams below show the break-up of the supercontinent Pangaea (meaning "all lands" in Greek), which figured prominently in the theory of continental drift -- the forerunner to the theory of plate tectonics.
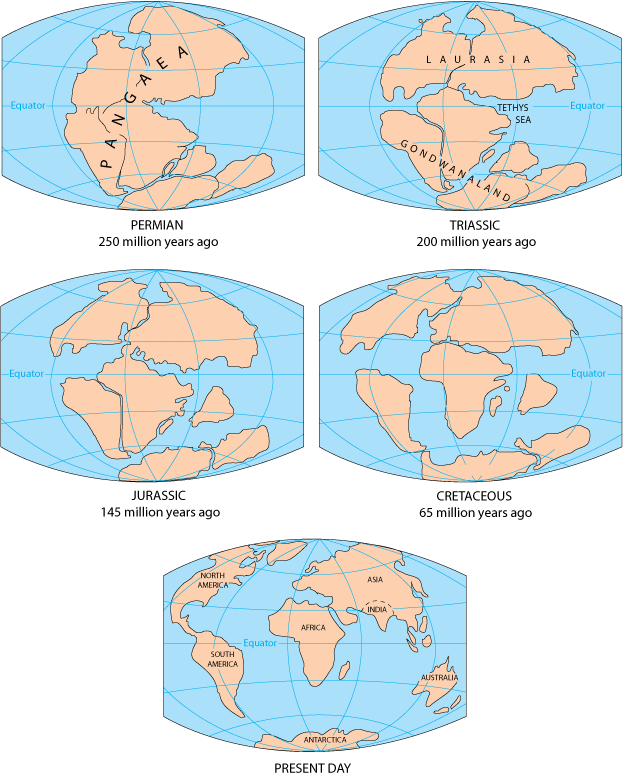
According to the continental drift theory, the supercontinent Pangaea began to break up about 225-200 million years ago, eventually fragmenting into the continents as we know them today.
Plate tectonics is a relatively new scientific concept, introduced some 30 years ago, but it has revolutionized our understanding of the dynamic planet upon which we live. The theory has unified the study of the Earth by drawing together many branches of the earth sciences, from paleontology (the study of fossils) to seismology (the study of earthquakes). It has provided explanations to questions that scientists had speculated upon for centuries -- such as why earthquakes and volcanic eruptions occur in very specific areas around the world, and how and why great mountain ranges like the Alps and Himalayas formed.
Why is the Earth so restless? What causes the ground to shake violently, volcanoes to erupt with explosive force, and great mountain ranges to rise to incredible heights?
Scientists, philosophers, and theologians have wrestled with questions such as these for centuries. Until the 1700s, most Europeans thought that a Biblical Flood played a major role in shaping the Earth's surface. This way of thinking was known as "catastrophism," and geology (the study of the Earth) was based on the belief that all earthly changes were sudden and caused by a series of catastrophes. However, by the mid-19th century, catastrophism gave way to "uniformitarianism," a new way of thinking centered around the "Uniformitarian Principle" proposed in 1785 by James Hutton, a Scottish geologist. This principle is commonly stated as follows: The present is the key to the past. Those holding this viewpoint assume that the geologic forces and processes -- gradual as well as catastrophic -- acting on the Earth today are the same as those that have acted in the geologic past.
The belief that continents have not always been fixed in their present positions was suspected long before the 20th century; this notion was first suggested as early as 1596 by the Dutch map maker Abraham Ortelius in his work Thesaurus Geographicus. Ortelius suggested that the Americas were "torn away from Europe and Africa . . . by earthquakes and floods" and went on to say: "The vestiges of the rupture reveal themselves, if someone brings forward a map of the world and considers carefully the coasts of the three [continents]." Ortelius' idea surfaced again in the 19th century. However, it was not until 1912 that the idea of moving continents was seriously considered as a full-blown scientific theory -- called Continental Drift -- introduced in two articles published by a 32-year-old German meteorologist named Alfred Lothar Wegener. He contended that, around 200 million years ago, the supercontinent Pangaea began to split apart. Alexander Du Toit, Professor of Geology at Witwatersrand University and one of Wegener's staunchest supporters, proposed that Pangaea first broke into two large continental landmasses, Laurasia in the northern hemisphere and Gondwanaland in the southern hemisphere. Laurasia and Gondwanaland then continued to break apart into the various smaller continents that exist today.
Wegener's theory was based in part on what appeared to him to be the remarkable fit of the South American and African continents, first noted by Abraham Ortelius three centuries earlier. Wegener was also intrigued by the occurrences of unusual geologic structures and of plant and animal fossils found on the matching coastlines of South America and Africa, which are now widely separated by the Atlantic Ocean. He reasoned that it was physically impossible for most of these organisms to have swum or have been transported across the vast oceans. To him, the presence of identical fossil species along the coastal parts of Africa and South America was the most compelling evidence that the two continents were once joined.
In Wegener's mind, the drifting of continents after the break-up of Pangaea explained not only the matching fossil occurrences but also the evidence of dramatic climate changes on some continents. For example, the discovery of fossils of tropical plants (in the form of coal deposits) in Antarctica led to the conclusion that this frozen land previously must have been situated closer to the equator, in a more temperate climate where lush, swampy vegetation could grow. Other mismatches of geology and climate included distinctive fossil ferns (Glossopteris) discovered in now-polar regions, and the occurrence of glacial deposits in present-day arid Africa, such as the Vaal River valley of South Africa.
The theory of continental drift would become the spark that ignited a new way of viewing the Earth. But at the time Wegener introduced his theory, the scientific community firmly believed the continents and oceans to be permanent features on the Earth's surface. Not surprisingly, his proposal was not well received, even though it seemed to agree with the scientific information available at the time. A fatal weakness in Wegener's theory was that it could not satisfactorily answer the most fundamental question raised by his critics: What kind of forces could be strong enough to move such large masses of solid rock over such great distances? Wegener suggested that the continents simply plowed through the ocean floor, but Harold Jeffreys, a noted English geophysicist, argued correctly that it was physically impossible for a large mass of solid rock to plow through the ocean floor without breaking up.
Undaunted by rejection, Wegener devoted the rest of his life to doggedly pursuing additional evidence to defend his theory. He froze to death in 1930 during an expedition crossing the Greenland ice cap, but the controversy he spawned raged on. However, after his death, new evidence from ocean floor exploration and other studies rekindled interest in Wegener's theory, ultimately leading to the development of the theory of plate tectonics.
Plate tectonics has proven to be as important to the earth sciences as the discovery of the structure of the atom was to physics and chemistry and the theory of evolution was to the life sciences. Even though the theory of plate tectonics is now widely accepted by the scientific community, aspects of the theory are still being debated today. Ironically, one of the chief outstanding questions is the one Wegener failed to resolve: What is the nature of the forces propelling the plates? Scientists also debate how plate tectonics may have operated (if at all) earlier in the Earth's history and whether similar processes operate, or have ever operated, on other planets in our solar system.
The belief that continents have not always been fixed in their present positions was suspected long before the 20th century; this notion was first suggested as early as 1596 by the Dutch map maker Abraham Ortelius in his work Thesaurus Geographicus. Ortelius suggested that the Americas were "torn away from Europe and Africa . . . by earthquakes and floods" and went on to say: "The vestiges of the rupture reveal themselves, if someone brings forward a map of the world and considers carefully the coasts of the three [continents]." Ortelius' idea surfaced again in the 19th century. However, it was not until 1912 that the idea of moving continents was seriously considered as a full-blown scientific theory -- called Continental Drift -- introduced in two articles published by a 32-year-old German meteorologist named Alfred Lothar Wegener. He contended that, around 200 million years ago, the supercontinent Pangaea began to split apart. Alexander Du Toit, Professor of Geology at Witwatersrand University and one of Wegener's staunchest supporters, proposed that Pangaea first broke into two large continental landmasses, Laurasia in the northern hemisphere and Gondwanaland in the southern hemisphere. Laurasia and Gondwanaland then continued to break apart into the various smaller continents that exist today.
Wegener's theory was based in part on what appeared to him to be the remarkable fit of the South American and African continents, first noted by Abraham Ortelius three centuries earlier. Wegener was also intrigued by the occurrences of unusual geologic structures and of plant and animal fossils found on the matching coastlines of South America and Africa, which are now widely separated by the Atlantic Ocean. He reasoned that it was physically impossible for most of these organisms to have swum or have been transported across the vast oceans. To him, the presence of identical fossil species along the coastal parts of Africa and South America was the most compelling evidence that the two continents were once joined.
In Wegener's mind, the drifting of continents after the break-up of Pangaea explained not only the matching fossil occurrences but also the evidence of dramatic climate changes on some continents. For example, the discovery of fossils of tropical plants (in the form of coal deposits) in Antarctica led to the conclusion that this frozen land previously must have been situated closer to the equator, in a more temperate climate where lush, swampy vegetation could grow. Other mismatches of geology and climate included distinctive fossil ferns (Glossopteris) discovered in now-polar regions, and the occurrence of glacial deposits in present-day arid Africa, such as the Vaal River valley of South Africa.
The theory of continental drift would become the spark that ignited a new way of viewing the Earth. But at the time Wegener introduced his theory, the scientific community firmly believed the continents and oceans to be permanent features on the Earth's surface. Not surprisingly, his proposal was not well received, even though it seemed to agree with the scientific information available at the time. A fatal weakness in Wegener's theory was that it could not satisfactorily answer the most fundamental question raised by his critics: What kind of forces could be strong enough to move such large masses of solid rock over such great distances? Wegener suggested that the continents simply plowed through the ocean floor, but Harold Jeffreys, a noted English geophysicist, argued correctly that it was physically impossible for a large mass of solid rock to plow through the ocean floor without breaking up.
Undaunted by rejection, Wegener devoted the rest of his life to doggedly pursuing additional evidence to defend his theory. He froze to death in 1930 during an expedition crossing the Greenland ice cap, but the controversy he spawned raged on. However, after his death, new evidence from ocean floor exploration and other studies rekindled interest in Wegener's theory, ultimately leading to the development of the theory of plate tectonics.
Plate tectonics has proven to be as important to the earth sciences as the discovery of the structure of the atom was to physics and chemistry and the theory of evolution was to the life sciences. Even though the theory of plate tectonics is now widely accepted by the scientific community, aspects of the theory are still being debated today. Ironically, one of the chief outstanding questions is the one Wegener failed to resolve: What is the nature of the forces propelling the plates? Scientists also debate how plate tectonics may have operated (if at all) earlier in the Earth's history and whether similar processes operate, or have ever operated, on other planets in our solar system.
Developing the theory
Continental drift was hotly debated off and on for decades following Wegener's death before it was largely dismissed as being eccentric, preposterous, and improbable. However, beginning in the 1950s, a wealth of new evidence emerged to revive the debate about Wegener's provocative ideas and their implications. In particular, four major scientific developments spurred the formulation of the plate-tectonics theory: (1) demonstration of the ruggedness and youth of the ocean floor; (2) confirmation of repeated reversals of the Earth magnetic field in the geologic past; (3) emergence of the seafloor-spreading hypothesis and associated recycling of oceanic crust; and (4) precise documentation that the world's earthquake and volcanic activity is concentrated along oceanic trenches and submarine mountain ranges.
Continental drift was hotly debated off and on for decades following Wegener's death before it was largely dismissed as being eccentric, preposterous, and improbable. However, beginning in the 1950s, a wealth of new evidence emerged to revive the debate about Wegener's provocative ideas and their implications. In particular, four major scientific developments spurred the formulation of the plate-tectonics theory: (1) demonstration of the ruggedness and youth of the ocean floor; (2) confirmation of repeated reversals of the Earth magnetic field in the geologic past; (3) emergence of the seafloor-spreading hypothesis and associated recycling of oceanic crust; and (4) precise documentation that the world's earthquake and volcanic activity is concentrated along oceanic trenches and submarine mountain ranges.
Ocean floor mapping
About two thirds of the Earth's surface lies beneath the oceans. Before the 19th century, the depths of the open ocean were largely a matter of speculation, and most people thought that the ocean floor was relatively flat and featureless. However, as early as the 16th century, a few intrepid navigators, by taking soundings with hand lines, found that the open ocean can differ considerably in depth, showing that the ocean floor was not as flat as generally believed. Oceanic exploration during the next centuries dramatically improved our knowledge of the ocean floor. We now know that most of the geologic processes occurring on land are linked, directly or indirectly, to the dynamics of the ocean floor.
"Modern" measurements of ocean depths greatly increased in the 19th century, when deep-sea line soundings (bathymetric surveys) were routinely made in the Atlantic and Caribbean. In 1855, a bathymetric chart published by U.S. Navy Lieutenant Matthew Maury revealed the first evidence of underwater mountains in the central Atlantic (which he called "Middle Ground"). This was later confirmed by survey ships laying the trans-Atlantic telegraph cable. Our picture of the ocean floor greatly sharpened after World War I (1914-18), when echo-sounding devices -- primitive sonar systems -- began to measure ocean depth by recording the time it took for a sound signal (commonly an electrically generated "ping") from the ship to bounce off the ocean floor and return. Time graphs of the returned signals revealed that the ocean floor was much more rugged than previously thought. Such echo-sounding measurements clearly demonstrated the continuity and roughness of the submarine mountain chain in the central Atlantic (later called the Mid-Atlantic Ridge) suggested by the earlier bathymetric measurements.

In 1947, seismologists on the U.S. research ship Atlantis found that the sediment layer on the floor of the Atlantic was much thinner than originally thought. Scientists had previously believed that the oceans have existed for at least 4 billion years, so therefore the sediment layer should have been very thick. Why then was there so little accumulation of sedimentary rock and debris on the ocean floor? The answer to this question, which came after further exploration, would prove to be vital to advancing the concept of plate tectonics.
In the 1950s, oceanic exploration greatly expanded. Data gathered by oceanographic surveys conducted by many nations led to the discovery that a great mountain range on the ocean floor virtually encircled the Earth. Called the global mid-ocean ridge, this immense submarine mountain chain -- more than 50,000 kilometers (km) long and, in places, more than 800 km across -- zig-zags between the continents, winding its way around the globe like the seam on a baseball. Rising an average of about 4,500 meters(m) above the sea floor, the mid-ocean ridge overshadows all the mountains in the United States except for Mount McKinley (Denali) in Alaska (6,194 m). Though hidden beneath the ocean surface, the global mid-ocean ridge system is the most prominent topographic feature on the surface of our planet.
Magnetic striping and polar reversals
Beginning in the 1950s, scientists, using magnetic instruments (magnetometers) adapted from airborne devices developed during World War II to detect submarines, began recognizing odd magnetic variations across the ocean floor. This finding, though unexpected, was not entirely surprising because it was known that basalt -- the iron-rich, volcanic rock making up the ocean floor-- contains a strongly magnetic mineral (magnetite) and can locally distort compass readings. This distortion was recognized by Icelandic mariners as early as the late 18th century. More important, because the presence of magnetite gives the basalt measurable magnetic properties, these newly discovered magnetic variations provided another means to study the deep ocean floor.
 |
| A theoretical model of the formation of magnetic striping. New oceanic crust forming continuously at the crest of the mid-ocean ridge cools and becomes increasingly older as it moves away from the ridge crest with seafloor spreading (see text): a. the spreading ridge about 5 million years ago; b. about 2 to 3 million years ago; and c. present-day. |
Early in the 20th century, paleomagnetists (those who study the Earth's ancient magnetic field) -- such as Bernard Brunhes in France (in 1906) and Motonari Matuyama in Japan (in the 1920s) -- recognized that rocks generally belong to two groups according to their magnetic properties. One group has so-called normal polarity, characterized by the magnetic minerals in the rock having the same polarity as that of the Earth's present magnetic field. This would result in the north end of the rock's "compass needle" pointing toward magnetic north. The other group, however, has reversed polarity, indicated by a polarity alignment opposite to that of the Earth's present magnetic field. In this case, the north end of the rock's compass needle would point south. How could this be? This answer lies in the magnetite in volcanic rock. Grains of magnetite -- behaving like little magnets -- can align themselves with the orientation of the Earth's magnetic field. When magma (molten rock containing minerals and gases) cools to form solid volcanic rock, the alignment of the magnetite grains is "locked in," recording the Earth's magnetic orientation or polarity (normal or reversed) at the time of cooling.
As more and more of the seafloor was mapped during the 1950s, the magnetic variations turned out not to be random or isolated occurrences, but instead revealed recognizable patterns. When these magnetic patterns were mapped over a wide region, the ocean floor showed a zebra-like pattern. Alternating stripes of magnetically different rock were laid out in rows on either side of the mid-ocean ridge: one stripe with normal polarity and the adjoining stripe with reversed polarity. The overall pattern, defined by these alternating bands of normally and reversely polarized rock, became known as magnetic striping.
As more and more of the seafloor was mapped during the 1950s, the magnetic variations turned out not to be random or isolated occurrences, but instead revealed recognizable patterns. When these magnetic patterns were mapped over a wide region, the ocean floor showed a zebra-like pattern. Alternating stripes of magnetically different rock were laid out in rows on either side of the mid-ocean ridge: one stripe with normal polarity and the adjoining stripe with reversed polarity. The overall pattern, defined by these alternating bands of normally and reversely polarized rock, became known as magnetic striping.
Seafloor spreading and recycling of oceanic crust

The discovery of magnetic striping naturally prompted more questions: How does the magnetic striping pattern form? And why are the stripes symmetrical around the crests of the mid-ocean ridges? These questions could not be answered without also knowing the significance of these ridges. In 1961, scientists began to theorize that mid-ocean ridges mark structurally weak zones where the ocean floor was being ripped in two lengthwise along the ridge crest. New magma from deep within the Earth rises easily through these weak zones and eventually erupts along the crest of the ridges to create new oceanic crust. This process, later called seafloor spreading, operating over many millions of years has built the 50,000 km-long system of mid-ocean ridges. This hypothesis was supported by several lines of evidence: (1) at or near the crest of the ridge, the rocks are very young, and they become progressively older away from the ridge crest; (2) the youngest rocks at the ridge crest always have present-day (normal) polarity; and (3) stripes of rock parallel to the ridge crest alternated in magnetic polarity (normal-reversed-normal, etc.), suggesting that the Earth's magnetic field has flip-flopped many times. By explaining both the zebralike magnetic striping and the construction of the mid-ocean ridge system, the seafloor spreading hypothesis quickly gained converts and represented another major advance in the development of the plate-tectonics theory. Furthermore, the oceanic crust now came to be appreciated as a natural "tape recording" of the history of the reversals in the Earth's magnetic field.
Additional evidence of seafloor spreading came from an unexpected source: petroleum exploration. In the years following World War II, continental oil reserves were being depleted rapidly and the search for offshore oil was on. To conduct offshore exploration, oil companies built ships equipped with a special drilling rig and the capacity to carry many kilometers of drill pipe. This basic idea later was adapted in constructing a research vessel, named the Glomar Challenger, designed specifically for marine geology studies, including the collection of drill-core samples from the deep ocean floor. In 1968, the vessel embarked on a year-long scientific expedition, criss-crossing the Mid-Atlantic Ridge between South America and Africa and drilling core samples at specific locations. When the ages of the samples were determined by paleontologic and isotopic dating studies, they provided the clinching evidence that proved the seafloor spreading hypothesis.
A profound consequence of seafloor spreading is that new crust was, and is now, being continually created along the oceanic ridges. This idea found great favor with some scientists who claimed that the shifting of the continents can be simply explained by a large increase in size of the Earth since its formation. However, this so-called "expanding Earth" hypothesis was unsatisfactory because its supporters could offer no convincing geologic mechanism to produce such a huge, sudden expansion. Most geologists believe that the Earth has changed little, if at all, in size since its formation 4.6 billion years ago, raising a key question: how can new crust be continuously added along the oceanic ridges without increasing the size of the Earth?
This question particularly intrigued Harry H. Hess, a Princeton University geologist and a Naval Reserve Rear Admiral, and Robert S. Dietz, a scientist with the U.S. Coast and Geodetic Survey who first coined the term seafloor spreading. Dietz and Hess were among the small handful who really understood the broad implications of sea floor spreading. If the Earth's crust was expanding along the oceanic ridges, Hess reasoned, it must be shrinking elsewhere. He suggested that new oceanic crust continuously spread away from the ridges in a conveyor belt-like motion. Many millions of years later, the oceanic crust eventually descends into the oceanic trenches -- very deep, narrow canyons along the rim of the Pacific Ocean basin. According to Hess, the Atlantic Ocean was expanding while the Pacific Ocean was shrinking. As old oceanic crust was consumed in the trenches, new magma rose and erupted along the spreading ridges to form new crust. In effect, the ocean basins were perpetually being "recycled," with the creation of new crust and the destruction of old oceanic lithosphere occurring simultaneously. Thus, Hess' ideas neatly explained why the Earth does not get bigger with sea floor spreading, why there is so little sediment accumulation on the ocean floor, and why oceanic rocks are much younger than continental rocks.
Concentration of earthquakes
During the 20th century, improvements in seismic instrumentation and greater use of earthquake-recording instruments (seismographs) worldwide enabled scientists to learn that earthquakes tend to be concentrated in certain areas, most notably along the oceanic trenches and spreading ridges. By the late 1920s, seismologists were beginning to identify several prominent earthquake zones parallel to the trenches that typically were inclined 40-60° from the horizontal and extended several hundred kilometers into the Earth. These zones later became known as Wadati-Benioff zones, or simply Benioff zones, in honor of the seismologists who first recognized them, Kiyoo Wadati of Japan and Hugo Benioff of the United States. The study of global seismicity greatly advanced in the 1960s with the establishment of the Worldwide Standardized Seismograph Network (WWSSN) to monitor the compliance of the 1963 treaty banning above-ground testing of nuclear weapons. The much-improved data from the WWSSN instruments allowed seismologists to map precisely the zones of earthquake concentration worldwide.
Understanding Plate motion
Scientists now have a fairly good understanding of how the plates move and how such movements relate to earthquake activity. Most movement occurs along narrow zones between plates where the results of plate-tectonic forces are most evident.
There are four types of plate boundaries:
- Divergent boundaries -- where new crust is generated as the plates pull away from each other.
- Convergent boundaries -- where crust is destroyed as one plate dives under another.
- Transform boundaries -- where crust is neither produced nor destroyed as the plates slide horizontally past each other.
- Plate boundary zones -- broad belts in which boundaries are not well defined and the effects of plate interaction are unclear.
Divergent boundaries occur along spreading centers where plates are moving apart and new crust is created by magma pushing up from the mantle. Picture two giant conveyor belts, facing each other but slowly moving in opposite directions as they transport newly formed oceanic crust away from the ridge crest.
Perhaps the best known of the divergent boundaries is the Mid-Atlantic Ridge. This submerged mountain range, which extends from the Arctic Ocean to beyond the southern tip of Africa, is but one segment of the global mid-ocean ridge system that encircles the Earth. The rate of spreading along the Mid-Atlantic Ridge averages about 2.5 centimeters per year (cm/yr), or 25 km in a million years. This rate may seem slow by human standards, but because this process has been going on for millions of years, it has resulted in plate movement of thousands of kilometers. Seafloor spreading over the past 100 to 200 million years has caused the Atlantic Ocean to grow from a tiny inlet of water between the continents of Europe, Africa, and the Americas into the vast ocean that exists today.
The volcanic country of Iceland, which straddles the Mid-Atlantic Ridge, offers scientists a natural laboratory for studying on land the processes also occurring along the submerged parts of a spreading ridge. Iceland is splitting along the spreading center between the North American and Eurasian Plates, as North America moves westward relative to Eurasia.

The consequences of plate movement are easy to see around Krafla Volcano, in the northeastern part of Iceland. Here, existing ground cracks have widened and new ones appear every few months. From 1975 to 1984, numerous episodes of rifting (surface cracking) took place along the Krafla fissure zone. Some of these rifting events were accompanied by volcanic activity; the ground would gradually rise 1-2 m before abruptly dropping, signaling an impending eruption. Between 1975 and 1984, the displacements caused by rifting totaled about 7 m.
In East Africa, spreading processes have already torn Saudi Arabia away from the rest of the African continent, forming the Red Sea. The actively splitting African Plate and the Arabian Plate meet in what geologists call a triple junction, where the Red Sea meets the Gulf of Aden. A new spreading center may be developing under Africa along the East African Rift Zone. When the continental crust stretches beyond its limits, tension cracks begin to appear on the Earth's surface. Magma rises and squeezes through the widening cracks, sometimes to erupt and form volcanoes. The rising magma, whether or not it erupts, puts more pressure on the crust to produce additional fractures and, ultimately, the rift zone.

East Africa may be the site of the Earth's next major ocean. Plate interactions in the region provide scientists an opportunity to study first hand how the Atlantic may have begun to form about 200 million years ago. Geologists believe that, if spreading continues, the three plates that meet at the edge of the present-day African continent will separate completely, allowing the Indian Ocean to flood the area and making the easternmost corner of Africa (the Horn of Africa) a large island.
Convergent boundaries
The size of the Earth has not changed significantly during the past 600 million years, and very likely not since shortly after its formation 4.6 billion years ago. The Earth's unchanging size implies that the crust must be destroyed at about the same rate as it is being created, as Harry Hess surmised. Such destruction (recycling) of crust takes place along convergent boundaries where plates are moving toward each other, and sometimes one plate sinks (is subducted) under another. The location where sinking of a plate occurs is called a subduction zone.
The type of convergence -- called by some a very slow "collision" -- that takes place between plates depends on the kind of lithosphere involved. Convergence can occur between an oceanic and a largely continental plate, or between two largely oceanic plates, or between two largely continental plates.
Oceanic-continental convergence
If by magic we could pull a plug and drain the Pacific Ocean, we would see a most amazing sight -- a number of long narrow, curving trenches thousands of kilometers long and 8 to 10 km deep cutting into the ocean floor. Trenches are the deepest parts of the ocean floor and are created by subduction.

Off the coast of South America along the Peru-Chile trench, the oceanic Nazca Plate is pushing into and being subducted under the continental part of the South American Plate. In turn, the overriding South American Plate is being lifted up, creating the towering Andes mountains, the backbone of the continent. Strong, destructive earthquakes and the rapid uplift of mountain ranges are common in this region. Even though the Nazca Plate as a whole is sinking smoothly and continuously into the trench, the deepest part of the subducting plate breaks into smaller pieces that become locked in place for long periods of time before suddenly moving to generate large earthquakes. Such earthquakes are often accompanied by uplift of the land by as much as a few meters.
On 9 June 1994, a magnitude-8.3 earthquake struck about 320 km northeast of La Paz, Bolivia, at a depth of 636 km. This earthquake, within the subduction zone between the Nazca Plate and the South American Plate, was one of deepest and largest subduction earthquakes recorded in South America. Fortunately, even though this powerful earthquake was felt as far away as Minnesota and Toronto, Canada, it caused no major damage because of its great depth.

Oceanic-continental convergence also sustains many of the Earth's active volcanoes, such as those in the Andes and the Cascade Range in the Pacific Northwest. The eruptive activity is clearly associated with subduction, but scientists vigorously debate the possible sources of magma: Is magma generated by the partial melting of the subducted oceanic slab, or the overlying continental lithosphere, or both?
Oceanic-oceanic convergence
As with oceanic-continental convergence, when two oceanic plates converge, one is usually subducted under the other, and in the process a trench is formed. The Marianas Trench (paralleling the Mariana Islands), for example, marks where the fast-moving Pacific Plate converges against the slower moving Philippine Plate. The Challenger Deep, at the southern end of the Marianas Trench, plunges deeper into the Earth's interior (nearly 11,000 m) than Mount Everest, the world's tallest mountain, rises above sea level (about 8,854 m).
Subduction processes in oceanic-oceanic plate convergence also result in the formation of volcanoes. Over millions of years, the erupted lava and volcanic debris pile up on the ocean floor until a submarine volcano rises above sea level to form an island volcano. Such volcanoes are typically strung out in chains called island arcs. As the name implies, volcanic island arcs, which closely parallel the trenches, are generally curved. The trenches are the key to understanding how island arcs such as the Marianas and the Aleutian Islands have formed and why they experience numerous strong earthquakes. Magmas that form island arcs are produced by the partial melting of the descending plate and/or the overlying oceanic lithosphere. The descending plate also provides a source of stress as the two plates interact, leading to frequent moderate to strong earthquakes.
Continental-continental convergence
The Himalayan mountain range dramatically demonstrates one of the most visible and spectacular consequences of plate tectonics. When two continents meet head-on, neither is subducted because the continental rocks are relatively light and, like two colliding icebergs, resist downward motion. Instead, the crust tends to buckle and be pushed upward or sideways. The collision of India into Asia 50 million years ago caused the Indian and Eurasian Plates to crumple up along the collision zone. After the collision, the slow continuous convergence of these two plates over millions of years pushed up the Himalayas and the Tibetan Plateau to their present heights. Most of this growth occurred during the past 10 million years. The Himalayas, towering as high as 8,854 m above sea level, form the highest continental mountains in the world. Moreover, the neighboring Tibetan Plateau, at an average elevation of about 4,600 m, is higher than all the peaks in the Alps except for Mont Blanc and Monte Rosa, and is well above the summits of most mountains in the United States.

 |
Above: The collision between the Indian and Eurasian plates has pushed up the Himalayas and the Tibetan Plateau. Below: Cartoon cross sections showing the meeting of these two plates before and after their collision. The reference points (small squares) show the amount of uplift of an imaginary point in the Earth's crust during this mountain-building process. |

Transform boundaries
The zone between two plates sliding horizontally past one another is called a transform-fault boundary, or simply a transform boundary. The concept of transform faults originated with Canadian geophysicist J. Tuzo Wilson, who proposed that these large faults or fracture zones connect two spreading centers (divergent plate boundaries) or, less commonly, trenches (convergent plate boundaries). Most transform faults are found on the ocean floor. They commonly offset the active spreading ridges, producing zig-zag plate margins, and are generally defined by shallow earthquakes. However, a few occur on land, for example the San Andreas fault zone in California. This transform fault connects the East Pacific Rise, a divergent boundary to the south, with the South Gorda -- Juan de Fuca -- Explorer Ridge, another divergent boundary to the north.
The zone between two plates sliding horizontally past one another is called a transform-fault boundary, or simply a transform boundary. The concept of transform faults originated with Canadian geophysicist J. Tuzo Wilson, who proposed that these large faults or fracture zones connect two spreading centers (divergent plate boundaries) or, less commonly, trenches (convergent plate boundaries). Most transform faults are found on the ocean floor. They commonly offset the active spreading ridges, producing zig-zag plate margins, and are generally defined by shallow earthquakes. However, a few occur on land, for example the San Andreas fault zone in California. This transform fault connects the East Pacific Rise, a divergent boundary to the south, with the South Gorda -- Juan de Fuca -- Explorer Ridge, another divergent boundary to the north.

The San Andreas fault zone, which is about 1,300 km long and in places tens of kilometers wide, slices through two thirds of the length of California. Along it, the Pacific Plate has been grinding horizontally past the North American Plate for 10 million years, at an average rate of about 5 cm/yr. Land on the west side of the fault zone (on the Pacific Plate) is moving in a northwesterly direction relative to the land on the east side of the fault zone (on the North American Plate).
Oceanic fracture zones are ocean-floor valleys that horizontally offset spreading ridges; some of these zones are hundreds to thousands of kilometers long and as much as 8 km deep. Examples of these large scars include the Clarion, Molokai, and Pioneer fracture zones in the Northeast Pacific off the coast of California and Mexico. These zones are presently inactive, but the offsets of the patterns of magnetic striping provide evidence of their previous transform-fault activity.
Plate-boundary zones
Not all plate boundaries are as simple as the main types discussed above. In some regions, the boundaries are not well defined because the plate-movement deformation occurring there extends over a broad belt (called a plate-boundary zone). One of these zones marks the Mediterranean-Alpine region between the Eurasian and African Plates, within which several smaller fragments of plates (microplates) have been recognized. Because plate-boundary zones involve at least two large plates and one or more microplates caught up between them, they tend to have complicated geological structures and earthquake patterns.
Rates of motion
We can measure how fast tectonic plates are moving today, but how do scientists know what the rates of plate movement have been over geologic time? The oceans hold one of the key pieces to the puzzle. Because the ocean-floor magnetic striping records the flip-flops in the Earth's magnetic field, scientists, knowing the approximate duration of the reversal, can calculate the average rate of plate movement during a given time span. These average rates of plate separations can range widely. The Arctic Ridge has the slowest rate (less than 2.5 cm/yr), and the East Pacific Rise near Easter Island, in the South Pacific about 3,400 km west of Chile, has the fastest rate (more than 15 cm/yr).
Evidence of past rates of plate movement also can be obtained from geologic mapping studies. If a rock formation of known age -- with distinctive composition, structure, or fossils -- mapped on one side of a plate boundary can be matched with the same formation on the other side of the boundary, then measuring the distance that the formation has been offset can give an estimate of the average rate of plate motion. This simple but effective technique has been used to determine the rates of plate motion at divergent boundaries, for example the Mid-Atlantic Ridge, and transform boundaries, such as the San Andreas Fault.
Current plate movement can be tracked directly by means of ground-based or space-based geodetic measurements; geodesy is the science of the size and shape of the Earth. Ground-based measurements are taken with conventional but very precise ground-surveying techniques, using laser-electronic instruments. However, because plate motions are global in scale, they are best measured by satellite-based methods. The late 1970s witnessed the rapid growth of space geodesy, a term applied to space-based techniques for taking precise, repeated measurements of carefully chosen points on the Earth's surface separated by hundreds to thousands of kilometers. The three most commonly used space-geodetic techniques -- very long baseline interferometry (VLBI), satellite laser ranging (SLR), and the Global Positioning System (GPS) -- are based on technologies developed for military and aerospace research, notably radio astronomy and satellite tracking.
More Info : Click Here
Brief Explanation :
The geological process by which the Earth came to have its present interior structure is called differentiation
Within about 1 billion years of its formation the Earth was melted by heat arising from a combination of sources:
Gravitational energy left from the formation of the planet,
Meteor bombardment
Decay of radioactive material trapped in the body of the Earth.
While the Earth was molten, gravity acted to concentrate more dense material near the center and less dense material nearer the surface. When the Earth solidified again (except for the liquid outer core) it was left with a layered structure with more dense material like iron and nickel near the center and less dense rocks nearer the surface. As the outer layers cooled and solidified, large cracks developed because of thermal stress, leaving the lithosphere broken up into large blocks or plates.It is now agreed that the crustal plates of the Earth are in horizontal motion. This is called continental drift colloquially, and plate tectonics in technically more precise language.The crust is thin, varying from a few tens of kilometers thick beneath the continents to to less than 10 km thick beneath the many of the oceans. The crust and upper mantle together constitute the lithosphere, which is typically 50-100 km thick and is broken into large plates (not illustrated). These plates sit on the aesthenosphere.
The aesthenosphere is kept plastic (deformable) largely through heat generated by radioactive decay. The material that is decaying is primarily radioactive isotopes of light elements like aluminum and magnesium. This heat source is small on an absolute scale (the corresponding heat flow at the surface out of the Earth is only about 1/6000 of the Solar energy falling on the surface). Nevertheless, because of the insulating properties of the Earth's rocks this is sufficient to keep the aesthenosphere plastic in consistency.
The original conjectures concerning plate tectonics were based on circumstantial evidence like the shapes of continents being such that they would fit well if pushed together. Today, we have a much broader set of evidence in favor of the hypothesis.
Indications of Tectonic Activity
Among the classes of evidence for continental drift and the underlying plate tectonics we may list
- The shapes of many continents are such that they look like they are separated pieces of a jig-saw puzzle. For example, look in the adjacent map at the shape of the east coast of North and South Americal relative to the shape of the west coast of Africa and Europe.
- Many fossil comparisons along the edges of continents that look like they fit together suggest species similarities that would only make sense if the two continents were joined at some point in the past.
- There is a large amount of seismic, volcanic, and geothermal activity along the conjectured plate boundaries. This is shown clearly below in the figure labeled "Crustal plate boundaries" where the epicenters of earthquakes above Richter magnitude 5.0 are plotted for a 10-year period. The concentration is striking, and indeed this plot serves to define the plate boundaries extremely well.
- There are ridges, such as the Mid-Atlantic Ridge (see figures above and below) where plates are separating that are produced by lava welling up from between the plates as they pull apart. Likewise, there are mountain ranges being formed where plates are pushing against each other (e.g., the Himalayas, which are still growing).
Age of the Sea Floor
If the crustal plates are pulling apart at boundaries like the Mid-Atlantic Ridge the sea floor near these ridges should be very young geologically, since it is formed of material upwelling from the interior.
Past and future consequences of plate tectonics for the Earth's surface are enormous.
Some Past and Present Consequences
Plate tectonics has been responsible for many of the features that we find on the surface of the Earth today.
- A few examples include The Appalachian Mountains were formed from wrinkling of the Earth's surface produced by the collision of the North American and African plates.
- The seismic and volcanic activity of the West Coast of the United States (for example, the San Andreas Fault) is produced by the grinding of the Pacific and North American Plates against each other. Indeed, the entire "ring of fire" around the Pacific, corresponding to regions of high volcanic and seismic activity, is caused primarly by the motion of the Pacific Plate.
- The Dead Sea in Israel is part of a rift system produced by plates that are pulling apart in that region.
- The Himalayan Mountains were formed (indeed are still growing) as a result of the Indian subplate burrowing under the Eurasian plate and raising its edge.
Some Future Consequences of Plate Tectonics
Plate tectonics is still an active process, and will drastically reshape the face of the Earth over the next 50 million years or so. A few consequences of plate tectonics based on projections of present motion include:
- Portions of California will separate from the rest of North America.
- The Italian "boot" will disappear.
- Australia will become linked to Asia.
- Africa will separate from the Near East.
Source : USGS

Monday, March 25, 2013
The Secret Life of Caves

Set against the back drop of awe inspiring geological beauty, a strange scientific adventure sets out to discover how a mineral clad cave network - the height of a 30 storey building and the length of six football fields - came to exist deep below the Guadalupe Mountains in North America.
But this journey soon unravels a multitude of inexplicable phenomena and obscure geological formations, leading to the discovery of extreme rock-eating microbes - a testimony from primordial Earth and a glimpse of life elsewhere in the Solar System.
But this journey soon unravels a multitude of inexplicable phenomena and obscure geological formations, leading to the discovery of extreme rock-eating microbes - a testimony from primordial Earth and a glimpse of life elsewhere in the Solar System.


Tuesday, February 12, 2013
PM’s address at the Conference of Governors

Following is the text of the Prime Minister, Dr. Manmohan Singh’s address at the Conference of Governors at Rashtrapati Bhavan, in New Delhi (February 2013)
“Over
the last two days, we have all benefited from the
presentations and discussions that have taken place in this conference.
Occasions like this help us not only in developing a deeper understanding of
issues of vital national importance, but also in prioritizing and planning for
the tasks ahead. The agenda before us covers some of the areas that are
critical for the socio-economic development of our country. I would like to
thank Respected Rashtrapati ji for organizing this
conference.
I
would also like to place on record my deep appreciation of the contribution
that the participating Governors have made in the last two days. You are
all very distinguished men and women, and your knowledge, wisdom and experience
constitute a very valuable asset that our country should make full use of.
I
have listened very carefully to all the participating Governors. Your deep
insights in many areas are truly impressive. As I go ahead, I will attempt to
respond to some of the views that have been expressed.
As
you are all aware, our economy has slowed down considerably in the last two
years. Growth in this fiscal year will be much below the average growth of
about 8.0% that we have achieved in the last decade. The factors that have
caused this slowdown lie both outside and within our country. The Finance
Minister has dealt with the causal factor's in some
detail. I can therefore be very brief in my remarks
on this subject. It is imperative that we do everything possible to reverse
this trend and the Government has made concerted and serious efforts in recent
months to revive investment and growth.
At
the Central Government level, efforts are being made to streamline the process
of clearance of investment proposals, paying particular attention to clearances
from the environment and forest angles as well as towards removal of
infrastructural bottlenecks. However, the climate for investment is also
affected by the activities of State Governments. Factors like the state of law
and order, and how easy or difficult it is to acquire land and obtain
electricity connections also have an important influence on the climate for
investment.
Policy
measures announced in the current year have generated optimism which is
reflected in an upturn in the Business Expectations Index for the
October-December quarter, the Purchasing Managers' Index in October- December
and buoyancy in capital markets. Internal accruals of the corporate sector,
necessary for a pick-up in investment, have also started improving. There has
also been a moderation in core inflation. These factors point towards recovery
in GDP growth in the second half of the current year.
A
high level of fiscal deficit has been a specific cause of worry for us in the
recent time. Our Government has broadly accepted the recommendations of the Kelkar Committee which was appointed to recommend a road
map for fiscal consolidation. We intend to contain the fiscal deficit for
the current year at 5.3% of GDP and reduce
it to 4.8% in the next year. The fiscal deficit is targeted to be reduced by
0.6 percentage points each year thereafter.
We have also taken steps to bridge the infrastructure deficit in areas such as Railways, roads, airports, ports irrigation, and water-supply, which have come under additional stress because of our rapid economic growth in the last decade. These include the setting up of the Cabinet Committee on Investments to expedite decisions on approvals and clearances for implementation of major projects.
We have also taken steps to bridge the infrastructure deficit in areas such as Railways, roads, airports, ports irrigation, and water-supply, which have come under additional stress because of our rapid economic growth in the last decade. These include the setting up of the Cabinet Committee on Investments to expedite decisions on approvals and clearances for implementation of major projects.
The
year 2012 saw clear signs of improvement in the Internal Security situation,
including in Jammu & Kashmir, the North East and Left Wing Extremism
affected areas. However, there is a lot which still needs to be done. The Home
Minister has briefed us of our plan of action to meet challenges such as
terrorism and Left Wing Extremism, which have both external and internal
dimensions.
Before
I proceed further on security issues let me say that I have paid particular
attention to the remarks of the Governors of Jammu & Kashmir and North Eastern
States on security
issues. Shri Vohra, Governor of Jammu &
Kashmir has made some suggestions for more
coherent action on the part of security agencies which I think are well worth
exploring. Similarly, there have been suggestions from Governor of Arunachal Pradesh, General J.J. Singh about border roads,
porter tracks and suspension bridges. His suggestion to pay adequate attention
to the improvement of living conditions in border villages is also well taken.
He as well as other Governors have suggested
strengthening of the Border Roads Organisation and
improving infrastructure in our border areas. The suggestion of Governor of
Assam and some other Governors of North Eastern States to accelerate the pace
of fencing along the Indo-Bangladesh Border also has merit. I am sure my
esteemed colleagues Raksha Mantri
Shri Antony and Home Minister Shri Shinde will have all such suggestions on security issues
examined to see what action is possible on them.
The
Government has taken several steps for the improvement of mechanisms and
instrumentalities to counter terrorism. These include strengthening of the
Multi Agency Centre (MAC) and the Subsidiary Multi Agency Centre (SMAC),
creation of four new hubs of the National Security Guard (NSG), construction of
coastal police stations and provision of high technology boats, setting up of
the National Investigation Agency, and creation of NATGRID. The passage of the
Unlawful Activities Prevention Act (Amendment) Bill in Parliament has given
more teeth to the extant anti-terror regime and is at par with international
standards.
In
a secular polity that India
is, the need for maintaining communal harmony can hardly be overemphasized.
Both the Centre and States have to pursue a well coordinated strategy to achieve
this objective.
On
the external front, we remain committed to working for good relations and
peaceful existence with our neighbors. However, we are also firm in our resolve
to deal effectively with any threat to our country. Incidents like the one that
took place on the LoC last month are against the
norms of civilized international behavior and are simply unacceptable to
us. We have also to recognize that our neighbourhood
is characterized by growing instability and uncertainty.
To
meet the entire spectrum of security challenges, the capabilities of both the
Armed Forces and the Police forces are being constantly strengthened through
provision of cutting edge technology and modern platforms. We are also
undertaking infrastructure development programs in the border areas to enhance
mobility as well as connectivity.
As
I have said on a number of occasions earlier, our strategy for dealing with the
menace of Left Wing Extremism is two pronged.
Even as we have intensified operations against the extremists, we have also
endeavored to bridge the development and governance deficit in the Left Wing
Extremist affected area, many of which have predominantly tribal
populations. The steps we have taken include deploying additional
Central forces, raising specialized forces, strengthening police stations and
imparting training to State police personnel in counter insurgency, jungle
warfare and anti- terrorism operations. The need for greater inter-State
coordination in operations against Left Wing Extremists was emphasized by
Governor of Andhra Pradesh, Shri E.S.L. Narasimhan.
One cannot agree more with him.
The Integrated Action Plan for 82 select and backward districts, most of which are affected by Left Wing Extremism, is beginning to show encouraging results. Road connectivity in these districts is also being improved. We have also taken steps to streamline the process for vesting of forest rights under the Scheduled Tribes and Other Traditional Dwellers (Recognition of Forest Rights) Act to the entitled people.
Due
to all these efforts, the geographical spread of the menace of Left Wing
Extremism has shown a shrinking trend. Further, the number of incidents of Left
Wing Extremist violence in 2012 showed perceptible decline compared with the
previous year. However, much more remains to be done and we will make all
efforts to accomplish what we still have to do. As has been pointed out
by Governor of Assam, the expansion of Maoist activities to upper and lower Assam is
worrisome.
Rashtrapatiji began his inaugural
remarks in this conference by mentioning that the horrific incident of
gang-rape in Delhi
had shaken the collective conscience of the country. The Government has been
prompt in acting on the recommendations of the Justice Verma
Committee by promulgating an Ordinance to strengthen the law to deal with
crimes of sexual assault of an extreme nature against women. We have also
taken a number of administrative measures to enhance the safety and security of
our women, particularly in public places. However, as Rashtrapatiji
said, real and effective change in the status of women in our country can come
only if there is a change in our societal values. This is a goal that all
of us need to collectively work for.
Here,
I would also like to point out that there is a need to sensitize the police
forces towards showing special care in dealing with crimes against the weaker
sections of our society, including women, Scheduled Castes and Scheduled
Tribes, Minorities and Children. There is also a need to induct more women in
our police forces. I urge the Governors to guide their State Governments in
this direction.
Under
the Constitution, Governors have been given special responsibility for
administration of the Scheduled Areas. They have a direct and critical role in
ensuring speedy development of these areas. These Constitutional arrangements
have played a very significant role in addressing the long standing demands and
aspirations of our tribal brothers and sisters, especially those belonging to
the North East. In the Sixth Schedule areas, the process of regular
elections, coupled with greater devolution of funds and functions, has
strengthened the Tribal Councils. In the Fifth Schedule areas, the Panchayats (Extension to Scheduled Areas) Act (PESA) has
ensured a greater say for the population in both local governance and control
over community resources. However, we still have a long way to go in terms of
strengthening democratic processes and ensuring devolution of funds, functions
and functionaries to the institutions of local self governance in the Scheduled
areas. I would urge the Governors to pay particular attention to the effective
implementation of the provisions of PESA and the Forest Rights Act. Shri Ram Naresh Yadav, Governor, Madhya
Pradesh had urged that the office of Governors be suitably equipped to
discharge the constitutional mandate in Fifth Schedule areas. He had also
raised the matter of formation of Tribes Advisory Councils. These issues need
to be looked into.
My
ministerial colleague, Shri Sharad Pawar has outlined the measures being taken to ensure our
food security and increase crop productivity, particularly in the Eastern
Region of our country. It is heartening to note that that the programme for ‘Bringing Green Revolution to Eastern India’ (BGREI) is yielding encouraging outcomes.
Adoption of modern agricultural practices through this programme
has resulted in record production of rice during the last year. Some States
have even doubled their rice production.
It
is very satisfying for our Government that the average rate of growth in
agriculture and allied sectors during the 11th Plan improved to 3.7% compared
with 2.4% in the 10th Plan. However, there are many challenges in this area
which need to be addressed on an urgent basis. These include environmental
degradation in many parts of our country that witnessed the Green Revolution,
bottlenecks in farmers’ access to affordable and timely credit facilities,
weaknesses in Agricultural R&D, inadequate food processing facilities, and barriers
to the free flow of agricultural products. The States in general need to
strengthen extension services. Smt. Margaret Alva,
Governor of Rajasthan has suggested that students of Agricultural Universities
should be involved in extension efforts. I would request the Agriculture
Minister to examine how this can be done.
One
of the items on the agenda for this Conference is the issue of Water Management
and Sanitation. There are several concerns that need to be addressed in this
area. These include a widening gap between availability and demand of water,
depleting ground water levels, polluted water bodies, and inadequate sanitation
facilities. These concerns were part of the deliberations during the meeting of
the National Water Resources Council held in December 2012. I am happy to
inform you that based on a broad consensus, the National Water Policy, 2012 has
been adopted by the Council. The New Water Policy contains several significant
recommendations like access to potable drinking water and sanitation for all,
uniform norms for urban and rural people, independent statutory Water
Regulatory Authorities for water pricing and water use efficiency benchmarks. I
would request Governors to encourage their State Governments to bring their
respective State Water Policies in alignment with the National Water Policy.
Over
the past several years, our Government has been implementing the National Rural
Drinking Water Programme (NRDWP) and the Jawaharlal
Nehru National Urban Renewal Mission (JnNURM) to
assist States in enabling the availability of safe drinking water in rural and
urban areas of our country. Reports indicate that approximately 74% of our
rural habitations have been provided with access to adequate safe drinking
water. I am happy to note that the Bharat Nirman target of providing adequate and safe drinking water
to identified and hitherto uncovered habitations has
been achieved. However, we still need to address the issue of contamination of
drinking water sources which affects many rural habitations. We also need
to ensure that Gram Panchayats and local communities
are fully involved in the planning, implementation and Operation
&Maintenance of rural water supply systems.
We
are now giving much more attention to the area of sanitation than before. In
order to accelerate the progress of sanitation in rural areas, a paradigm shift
has been made in the Total Sanitation Campaign which is now called the ‘Nirmal Bharat Abhiyaan’
in the 12th Plan. Our goal is to achieve 100% access to sanitation for all
rural households by 2022. While on the subject of Sanitation, I would also like
to inform Governors that last year we introduced a new Bill in Parliament for
the elimination of manual scavenging and the rehabilitation of manual
scavengers. The new Bill seeks to put an end to the dehumanizing practice of
manual scavenging. I am hopeful that Parliament will soon enact the proposed
legislation.
The need for access to good quality education for our citizens cannot be over emphasized. Our potential demographic dividend can very easily turn into a liability if we are not able to equip our youth with the right types of education and skills.
We
have invested in and expanded access to Higher Education on an unprecedented
scale. During the 11th Plan period, 16 new Central Universities were
established. In addition 7 new Indian Institutes of Management (IIMs), 8 new Indian Institutes of Technology (IITs), 10 new National Institutes of Technology (NITs), 5 Indian Institutes of Science Education and
Research (ISERs) and 2 new Schools of Planning and
Architecture (SPAs) were set up. Several measures
were taken to enhance the quality of education and research in institutions of
higher learning, and address the concerns for equity. Our initiatives have
shown positive results. For example, the Gross Enrollment Ratio (GER) for
higher education has grown to 18.1%, from 12.3% in 2006-07.
During
the 12th Plan, we will continue our focus on expansion, equity and excellence
with greater emphasis on the quality of Higher Education, while consolidating
the gains of the 11th Plan. Our goal is to raise the GER in Higher Education to
25.2% by 2017 and 30% by 2020. We also propose to launch a Rashtriya
Ucchatar Shiksha Abhiyan (RUSA) in the 12th Plan to provide strategic
funding to State institutions in an outcome based manner. A National Mission on
Teachers and teaching is also being launched. The National Mission in Education
through ICT and the National Knowledge Network will provide the backbone and
content for greater collaboration among students and teachers. A national
initiative for greater inclusion of socially disadvantaged sections of SCs, STs, Minorities, Backward
Classes, Girls and Persons with Disabilities is also planned along with a National
Initiative in Indian Languages.
The
State Governments have a critical role to play in the formulation and
implementation of educational policies. I would urge Governors, as Chancellors
of State Universities, to take an active interest in toning up the quality and
administration of higher education in their States, and guiding the State
Universities to lay much greater emphasis on research and innovation. Some
Governors have complained about lack of clarity of the role and functions of
the Chancellors. I would request HRD Minister to examine if guidelines could be
formulated to clarify these matters.
Our
Government has been alive to the need to curb corruption in public life and
improve the processes of governance. This is a pre-requisite for achieving our
efforts towards the development and progress of our nation. We remain
committed to the enactment of the Lokpal and Lokayuktas legislation. We hope Parliament will pass
this Bill shortly. The Public Interest Disclosure and Protection of Persons
Making the Disclosure Bill, The Prevention of Bribery of Foreign Officials and
Officials of Public International Organizations Bill, Citizens Right to
Grievance Redressal Bill are all under consideration
of the Parliament. Shri E.S.L. Narasimhan spoke about
the need for providing effective protection to well-meaning civil servants,
particularly those who have retired. The Government is considering amendments
to the Prevention of Corruption Act not only to enable faster punishment of the
guilty public servants but to also provide more effective protection to those
who are honest.
The Direct Benefits Transfer Scheme is an important step that the Government has taken to improve targeting, reduce corruption, eliminate waste and enhance efficiency in the public delivery system. We plan to incrementally roll out the scheme from identified districts to the whole country to deliver benefits of identified schemes to the beneficiaries. The Aadhar Numbers being issued by the Unique Identification Authority of India (UIDAI) constitute an integral element of the Direct Benefits Transfer strategy. This Scheme is also expected to bring about unprecedented financial inclusion of our rural masses.
The Direct Benefits Transfer Scheme is an important step that the Government has taken to improve targeting, reduce corruption, eliminate waste and enhance efficiency in the public delivery system. We plan to incrementally roll out the scheme from identified districts to the whole country to deliver benefits of identified schemes to the beneficiaries. The Aadhar Numbers being issued by the Unique Identification Authority of India (UIDAI) constitute an integral element of the Direct Benefits Transfer strategy. This Scheme is also expected to bring about unprecedented financial inclusion of our rural masses.
Smt Margaret Alva, Governor of Rajasthan and
Shri Nikhil Kumar, Governor of Nagaland
have advised caution in going ahead with the Direct Benefits Transfer
Scheme. Their concern is about inadequate coverage under Aadhar and unsatisfactory coordination with the State
Governments respectively. I am sure that the Finance Minister, Deputy
Chairman, Planning Commission and Shri Nandan Nilekani have taken note of these concerns and will take
action to address them.
Shri
E.S.L. Narasimhan, Governor of Andhra Pradesh has
emphasized the need for more efficient use of scarce resources by concentrating
them on fewer programmes, and better targeting of beneficiaries. I am happy to
inform all of you that the Government is actively considering reduction in the
number of Centrally Sponsored Schemes so as to make them more focused and
useful.
These
are some of the thoughts that I wished to share with you today. Let me conclude
by once again thanking Rashtrapati ji. I also wish
the Governors all success in your efforts towards building a modern, prosperous
and liberal India.
Subscribe to:
Posts (Atom)